Each chart consists of at least one chart pane. A chart pane is a section of a chart that can hold symbols, studies and other chart objects. Many chart settings apply to a specific chart pane, like the background color, the vertical price scales and the header, but all chart panes share the same horizontal time scale.
You can use chart panes to display many symbols in one chart without overlaying them (Inserting, Overlaying and Changing Symbols in a Chart) or to display certain studies in a separate section of the chart, especially when they use another scale than the symbol they are based on (for example most oscillators).
When you create new chart panes, every pane is automatically assigned an ascending number. The chart pane displayed at the top of a chart is always called Pane 1.
▪ Place the mouse pointer on the line above the horizontal time scale. The mouse pointer changes.
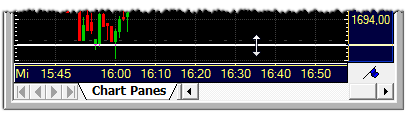
▪ Hold the mouse button down and drag the line upwards. A new empty chart pane appears.
▪ Release the mouse button when the size of the new pane is big enough.
▫ When you insert a symbol into a chart, it is automatically added in an additional chart pane. You can use the command Insert > Symbol, or drag and drop a symbol from another document. See Inserting, Overlaying and Changing Symbols in a Chart for details.
▫ When you insert a study into a chart, you can choose in which pane it will appear. If you choose Top or Bottom, the study is added in an a new chart pane at the top / bottom of the chart. See Defining the Appearance of a Study for details.
Note If you want to insert the same studies in one pane, instead of multiple panes, select Insert the same studies in the same pane option under Tools > Options > Chart, For example, if you insert MACD study (using different parameters) on a chart two times in a row, MACD studies will be displayed in one pane instead of two. See Chart Settings.
▪ Place the mouse pointer on the separation line between two chart panes. The mouse pointer changes.
▪ Hold the mouse button down and move the mouse up or down to resize the pane.
▪ Click the Data View button  and choose Equalize Panes Height.
▪ In the Chart Properties dialog, click the name of the chart pane, for example Pane 1.
▪ Under Pane margins (in pixels), enter the size of the Top and Bottom margins. The maximum size is 100 pixels. See also Changing the Background Color of a Pane.
Note If you want to increase the right margin of the chart pane, i.e. add space between the last bar and the price scale, see Extending the Time Line to the Future.
▪ Right-click the chart pane that you want to close and choose Close Pane.
▪ Right-click the chart pane that you want to keep and choose Close All Panes Except.
Note A chart consists of at least one chart pane. Therefore, one pane must remain open.