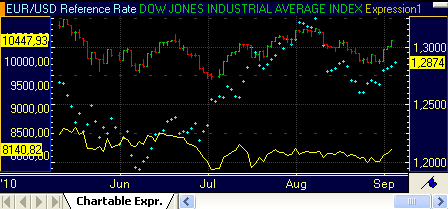
Chartable expressions use symbols that are displayed on the current chart. Additionally, you can use existing studies and expressions when creating a new expression. Before you insert an expression, make sure that all symbols, studies and expressions that you want to use are present in the chart (it’s ok if they are hidden, see Customizing Chart Objects). When you insert a chartable expression, you can choose operators and symbols from pop-up lists or add operators and numbers to your expression manually.
As there are many possible uses for expressions, we will introduce them with a simple example. For more details about the syntax of chartable expressions, see Syntax of Chartable Expressions.
This chartable expression divides the Dow Jones Industrial Average index by the EURUSD exchange rate.
▪ Make sure that both the Dow Jones Industrial Average (DJIA) and EURUSD rate are inserted into the chart. See also Inserting, Overlaying and Changing Symbols in a Chart.
▪ In the chart pane where you want to insert the expression, type an equal sign = .
▪ In the list that appears, double-click your first symbol, the DJIA.

▪ In the field list, double-click the CLOSE field. You can scroll the list to reveal more fields and basic operators.

▪ Type the / operator.
▪ Double-click your second symbol in the symbol list, the EURUSD rate, and then double-click the CLOSE field in the field list.
▪ Press the Enter key. The expression is now added to your chart (shown as a yellow line below). You can change the appearance of this line: See Changing the Appearance of Chartable Expressions for details.

This chartable expression shows the difference between the Dow Jones Industrial Average index close price and the Moving Average Simple study.
▪ Make sure that Dow Jones Industrial Average (DJIA) and Moving Average Simple study are inserted into the chart.
▪ In the chart pane where you want to insert the expression, type an equal sign = to start the chartable expression.
▪ In the list that appears, double-click the symbol name, Dow Jones Industrial Average (DJIA).

▪ In the field list, double-click the CLOSE field.

▪ Continue creating your expression by selecting the minus operator – and then double-click the MOVS(21,0) field.

▪ After you have finished writing the expression, press the Enter key. The expression is now added to your chart (sown as a red line below).

Note Once you created the expression, you can use it as an input value for other chartable expressions.
▪ Right-click the chartable expression line and choose Properties.
▪ In the Chart Properties dialog, click the name of the expression.
▪ Edit the calculations in the field Chartable Expression. See also Syntax of Chartable Expressions.
▪ Click Apply or OK to save your changes.
▪ Right-click on the line of the expression and choose Delete.
Note If you remove one of the symbols that are used in the chartable expression from the chart, the expression is automatically removed, too.
 Syntax of Chartable Expressions