You can easily compare the performance of two or more symbols by using chart overlays and a percentage price scale.
▪ Overlay several symbols in one chart pane with the command Insert > Overlay, for example some stocks and their index. See Inserting, Overlaying and Changing Symbols in a Chart for details.
▪ Click on the arrow next to the Chart Type icon in the Chart toolbar and choose the scale type Linear Percentage:

▪ Now, set a common starting point for the relative performance of all overlaid symbols. Click on the Set Vertical Scale Zero Point icon in the Drawing toolbar:

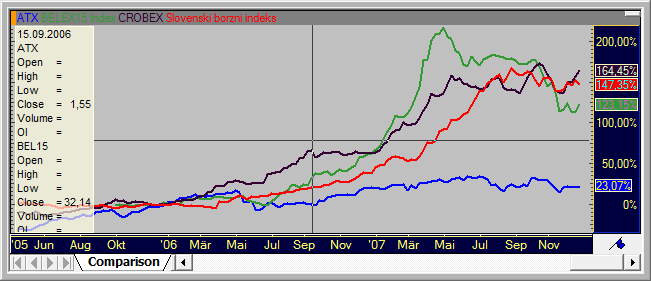
▪ Click on the chart at the date / time that you want to use as the starting point for the relative performance of all inserted symbols. This date / time is now the common zero point for the comparison, which means that the relative performance of all overlaid symbols is calculated starting from this date / time.