The Fibonacci Fan starts with a trend line (base line) and creates support / resistance lines at the so-called Fibonacci levels of 38,2%, 50% and 61,8%.
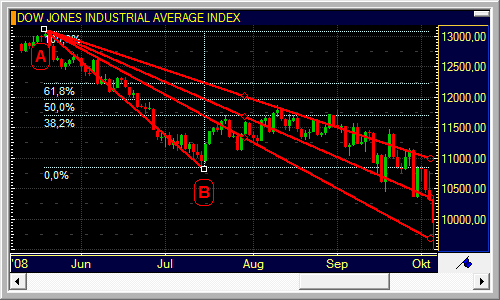
To draw a Fibonacci Fan, you need two reference points (A and B) that define the base line. Both reference points are positioned at recent consecutive pivots (for example, a high and the following low). The vertical distance between the two reference points (shown as the auxiliary blue dotted line on the picture below) is divided into the Fibonacci levels. The fan lines are drawn from point A through the Fibonacci levels.
All Fibonacci drawing tools are based on the belief that the price development of securities is related to the numbers of the Fibonacci sequence, a mathematical series of numbers that was discovered in the twelfth century, and the so-called Fibonacci levels, which are derived from the ratios of consecutive Fibonacci numbers. Fibonacci numbers and Fibonacci ratios also appear in nature, for example in the arrangement of leaves in a sunflower, and in the golden ratio, which is used for example in architecture and paintings.
The base line (reference line) of the fan is hidden by default, but you can also display it on the chart. Additionally, you can choose which levels of the fan are displayed, customize the ratios used to calculate the levels, change the line style for the fan lines, and show / hide the labels for each level: See Customizing Fibonacci Fans.
▪ Click on the Fibonacci Fan icon on the Drawing toolbar: 
▪ Click on the chart at the first reference point of your base line (A) and hold the mouse button down.
▪ Move the mouse pointer to the second reference point of your base line (B) and release the mouse button.
You can extend the fan lines to the right by using extension points: See Extending and Shortening Lines with Extension Points. To hide some of the lines, see Hiding and Showing Lines / Levels with Visibility Points.