 Request
historical data in Microsoft Excel using Excel Add-in
Request
historical data in Microsoft Excel using Excel Add-in
Improved
Quick Quote document with market depth and configurable columns
News
Flash rows available in Vertical Price Pages
New
search option available: Search on News database and Quick Keyword
Search
Keyword
commands for opening documents
Remaining
time to next bar in Intraday and Tickbar charts
Color
matching for studies: Inherit the color of the base symbol on overlaid
charts
Single
pane overlaying for studies: Open same study in the same pane
Set
number of decimal places directly from a chart document
Hide
values in chart data table if the symbol, study or expression is hidden
Group
number label for Fibonacci Retracements / Expansions and Fibonacci Vertical
Lines
Additional
custom and standard levels for Fibonacci Vertical Lines
Changing
the number of decimal places in Time and Sales
Opening
related symbol lists for index constituents (chains) and using templates
Visually
modifying stop and limit prices of working orders on the chart
Order
Book: Option to remove pre-defined orders on sending
Multiple
cash accounts visible in the portfolio document
With the new TeleTrader Professional Add-in for Excel, you can now generate RTD or DDE links for retrieving historical data using a graphical user interface.

▪ Open a Microsoft Excel spreadsheet and click the TeleTrader Professional ribbon in the Excel toolbar.
▪ Choose between DDE Server and RTD Server and click Show.
▪ In the Formula Generator pane, set the desired Symbol name, Interval, Time Series and Quote Elements.
▪ Select the cell in the Excel spreadsheet where you want to insert the data (it will be inserted to the right and down from that cell, depending on the amount of historical data you defined).
▪ Click Insert.
|
Symbol |
Defines the symbol identification number (for example {829802} ) or unique name (for example MSFT_0FSPC) of the symbol for which you want to retrieve historical data. If you don't know the symbol's identification number, enter the symbol name, ISIN or WKN in the field and click the Search button. In the Symbol Search Results dialog, double-click the symbol that you want to use. |
|
Interval |
Choose the desired time compression for the historical data series. |
|
Start Date |
Choose the first date for the historical data series. |
|
End Date |
Choose the last date for the historical data series. |
|
Records |
Enter the number of retrieved historical data records – this setting defines the number of rows that will be added in the spreadsheet. |
|
Display Time |
Select this option to show time stamps in the Start Date and End Date date pickers (relevant when using Intraday data). |
|
Sort Descending |
Check to sort the historical data in descending order (newest data on top). Clear to sort the historical data in ascending order (oldest data on top). |
|
Quote Elements |
Select all quote elements that you want to show for the historical data series - this setting defines the number of columns that will be added in the spreadsheet. |
|
Select All |
Selects all quote element items. |
|
Insert |
Copies DDE or RTD formulas into the Excel spreadsheet, based on the selections above. |
Note This interface can be used with Excel 2007 (or higher). During installation of the latest version of TeleTrader Professional, you might be required to download and install Microsoft VSTO 2010 Runtime, which is a prerequisite for running the TeleTrader Professional Add-in for Excel. If you don't install Microsoft VSTO 2010 Runtime, you will still be able to use RTD and DDE links, but you will not be able to use the new graphical user interface of the Add-in.
For more detailed information about requesting historical data in Microsoft Excel, see the TeleTrader Professional User Guide under Help > Help.
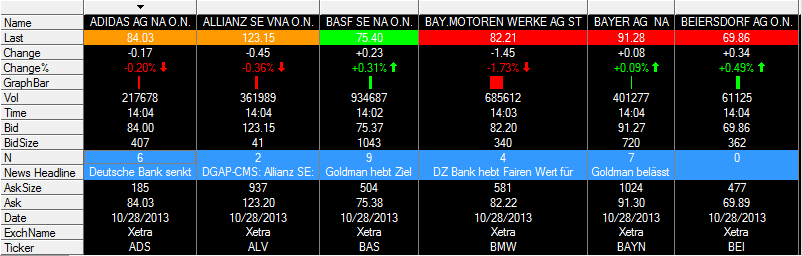
The improved Quick Quote document, which displays the price activity of one specific symbol, now lets you to:
▫ Display the first five levels of market depth inside the Quick Quote document
▫ Configure the number of columns (data fields) visible in the Quick Quote document, instead of selecting between horizontal and vertical layout.


Market Depth in QQ document Configuring the number of columns in QQ document
When opening a new Quick Quote document, market depth is hidden by default. You can show it by right-clicking in the document and selecting Show Market Depth View from the context menu. The Quick Quote document will automatically resize to increase content, and five levels of market depth will be visible at the bottom of the document.
Quick Quote now also allows you to adjust the number of visible columns for up to ten columns. To change the number of columns, right-click the document and choose Properties. In the Quick Quote Properties dialog, adjust the number of columns using the option Number of field columns. After that, the width of the Quick Quote document will be automatically re-adjusted based on the selected number of columns.
The News Flash option, which shows the latest related news stories for a symbol, is now also available in Vertical Price Page documents.
To add News Flash rows to your Vertical Price Page, right-click in the window and select News Flash from the context menu.
When searching for news using the Search option (previously called Find), it is now possible to search the complete TeleTrader news database using the new, enhanced search dialog, or by just typing your keyword into the news document (Quick Keyword Search).
To search the news database using the Search dialog:
▪ Right-click a news
headline and choose Search, or click the  icon in the toolbar.
▪ Click the Search on News database radio button.
Note By default, the Search on News database option is selected. If instead you want to search only for news that are already loaded in the news document, just click the Local Search radio button.
▪ Enter your search terms in the Search for field
▪ Press the Enter key or click OK.
▪ Search results will be
displayed directly in the news document. If you want to reset the news document
to its previous settings (and remove the search results), press the Home key or use the Clear news search  icon in the toolbar.
▪ In the news document, type your search term, for example DJI.
▪ Press the Enter key. The search is performed for the keyword DJI using the default settings from the Filter section of the News Properties dialog, applying the rule Match whole word only.
▪
Search results will be displayed directly in the news document. If
you want to reset the news document to its default settings (and remove the
search results), press the Home key or use
the Clear news search icon in the toolbar.
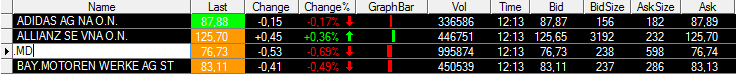
This version of TeleTrader Professional introduces keyword commands that can be used for quickly opening documents from the TeleTrader Professional main window, or from any already opened document. Keyword commands are typed commands that are entered in the same way as chartable expressions (by just typing the command into the respective document).
To open a symbol in a specific document, type the appropriate keyword command (see below) over the symbol and press the Enter key. For example, to open a market depth document from an existing price page, click in the row of the desired symbol, type .MD and press Enter.
|
Keyword |
Action |
|
.PP |
Opens the Price Page document |
|
.VP |
Opens the Vertical Price Page document |
|
.WL |
Opens the Watchlist document |
|
.CH |
Opens the Chart document |
|
.MD |
Opens the Market Depth document |
|
.TS or .T&S |
Opens the Time & Sales document |
|
|
Opens the Quick Quote document |
|
.NEWS |
Opens the News document |
You can also open a generic document containing a default symbol (DAX), by typing the appropriate keyword command into the empty TeleTrader Professional main window or into the news document and pressing the Enter key.
In addition to the keyword commands for opening documents as listed above, several chart-specific keyword commands have been introduced. You can use those for resetting the chart to its default settings (.RESET) as well as changing the chart type (for example .CANDLE, .BAR etc.), chart compression (for example .D, .M, .3H etc.) and time region (for example .LAST 5D, .AFTER 8/8/13 etc.).
To use one of the chart keyword commands, type the appropriate keyword command on the chart and press the Enter key. For example, to change a candlestick chart to a line chart, type .LINE into the chart and press the Enter key. You can also use keyword abbreviations instead of the full keyword, for example .LI or .CA.

For more detailed information about the new keyword commands in chart documents, see the TeleTrader Professional User Guide under Help > Help.
The chart header of each Intraday and Tickbar charts now shows the time (or ticks) that remain until the current bar is completed in the upper right corner of the chart. For the active chart document, this information is also shown in the status bar.


This new feature allows studies in overlaid charts to automatically inherit the color of their base symbol. To enable this option, select Activate study color inheritance on overlaid charts under Tools > Options > Chart. When this option is active, all symbols on overlaid charts will automatically switch to single color mode; when adding studies to the chart, they will inherit the color of their base symbol.


Default behavior: Multiple colors Optional: Single color mode with inherited study colors
When inserting the same study two times in a row, it is now possible to easily insert both studies in the same pane. To enable this option, select Insert the same studies in the same pane under Tools > Options > Chart. For example, if you insert an MACD study on a chart two times in a row (with different parameters), both MACD studies will automatically be displayed in one pane instead of two.
You can now change the number of decimal places used for a chart and its data table directly in the chart document. By default, the number of decimals used in chart and data table is based on the number of decimals defined for that symbol in price pages.
To change the number of decimals in a chart, right-click into the chart pane and choose Set decimal places from the context menu. When the Set decimal places dialog appears, adjust the number of decimals that should be used for that particular pane.
Note The custom decimal places set for the chart pane will be applied to drawing tools, expressions, studies and all values in data info box except to Volume and Open Interest.
Hide values in chart data table if the symbol, study or expression is hidden
From this version on, when hiding a symbol, study or expression in a chart using the option Hide from the context menu, their corresponding columns will be also automatically hidden in the data table view. For example, if you hide a symbol in a chart, the symbol columns Open, High, Low, Close, Volume and OI will be hidden in data table view, or if you hide the MACD study, the corresponding columns MACD, Trigger, Lower and Upper will be hidden.
Once you unhide them by using the option Show Hidden Object from the chart context menu, the object will become visible again on the chart, with all appropriate columns visible in data table view.
A new option for displaying labels for Fibonacci Retracements, Fibonacci Expansions and Fibonacci Vertical Lines is available. It allows you to display the number of each Fibonacci tool drawn on a chart, which is taken from the tool's name defined under Chart Properties > Fibonacci Retracement / Expansion > Title. It is used for easier distinguishing between different Fibonacci levels if multiple tools are plotted on a chart.
To enable this option, right-click the chart and select Properties. Under Chart Properties > Fibonacci Retracement / Expansion > Levels, check the Show group number option.
Additional custom and standard levels were added for the drawing tool Fibonacci Vertical Lines. The available levels now range from -34,000 to 6765,000. Besides showing a group number (see above), you can further customize how label text should be displayed, by using one of the following options from the Chart Properties dialog:
|
Show group number |
Display group number with each line |
|
Show line number |
Display number of each line (like in the data info box) |
|
Show date |
Display date and time of corresponding vertical line |
|
Show period |
Display Fibonacci number P (P0, P1, P2 etc.) |
|
Use custom values |
Apply custom values for levels for Fibonacci vertical line |
For more detailed information about the Fibonacci drawing tools, see the TeleTrader Professional User Guide under Help > Help.
You can now change the number of decimal places for a specific column or symbol also from time and sales documents by using the command Set decimal places:
▫ To apply the changes only to the selected column, right-click the respective column header
▫ To apply the changes to the symbol (also applies to other documents), right-click in the time and sales view
When right-clicking a symbol, you can use the command Related Symbols to search for related symbol lists and display them in a price page. In addition to symbol lists with the same ISIN and/or type, for some symbols, for example stocks that are part of an index, you can open a related index chain in a price page by clicking the name of the index chain (for example DAX #XETRA). If you want to open the price page with a specific template, right-click the name of the index chain and choose the desired template from the list that appears.
Chain symbols do not hold data from one security, but are a pointer to a list of "normal" symbols, in that case index constituents. The list of symbols contained in a chain is automatically updated on the server, thus the price page opened from a chain symbol will be immediately updated whenever symbols are added to or removed from the list.
For more detailed information about the behavior of chain symbols in price pages and other documents, see the TeleTrader Professional User Guide under Help > Help.
Current positions and working orders are displayed on the chart of the traded security as so-called trade tools. For working orders, those trade tools consist of a price line at the level of the Limit or Stop price of your order, and of a label that shows you some information about the order.
Starting with this version, you can modify the Limit or Stop price of your orders by visually moving the price line of the trade tool to a different price level with drag and drop. You must confirm the new Limit or Stop price before the modified order is sent to the banking system.
In the Order Book, you can save pre-defined orders that you want to transmit to the exchange at a later point in time. By default, pre-defined orders will be kept in the order book until you remove them manually.
Alternatively, you can let TeleTrader Professional automatically remove a pre-defined order from the order book as soon as it is transmitted to the banking system: To achieve this, deactivate the new option Keep pre-defined orders in the order book when transmitted under Trade > Settings.
If you have additional cash accounts in foreign currencies, their account balance and buying power are automatically shown in your portfolio document.
The following bugs have been fixed:
▫ Custom defined width of a study column in a price page was not saved if document was saved in a workspace.
▫ When a chartable expression was hidden and then displayed again using Show Hidden Object from a context menu, expression name was not correctly displayed.
▫ When inserting the Correlation study based on the symbol and a Moving Average, and a new symbol was overlaid on the chart, the second base of Correlation study changed from Moving Average to the newly added symbol.
▫ RTD historical formula returned 0 for VOLLAST data field.
▫ When saving a chart while the Crosshair or Vertical Line tool were active, this setting and its exact position on the chart were not saved in the Chart document or workspace.
▫ Set as Default option in the Chart Properties dialog did not work for Fibonacci Vertical Lines.
▫ In some cases, a redundant line of data was shown in the time and sales document.
▫ In the trading integration, profit/loss labels shown on the chart displayed wrong values for bonds.
▫ In the trading integration, trade tool lines on the chart were still visible although all display options in the Chart Properties dialog were deactivated.
The following studies have been added:
▫ Sector Rotation Model, as featured in Stocks & Commodities, August 2012: A market sector is a group of companies conducting similar types of business, and a sector rotation model (SRM) is a paradigm that describes which sectors are expected to be the most active during various periods of the economic cycle. Thus, an SRM could be used to find the top performing sectors in the stock market.
▫ Camarilla Points, as featured in Stocks & Commodities, March 2013: This study provides general areas of support and resistance, which are similar to pivot points and are eight levels around which market prices fluctuate — four levels of resistance and four levels of support; fifth levels of resistance & support have been added to handle breakouts.
For detailed information about the new studies, refer to the Analysis Tools manual, which is accessible from the Help menu.
|
Hardware |
PC with 1,66 GHz or higher |
|
Operating System |
Windows 8, Windows 7 (recommended), Windows Vista,
Windows XP |
|
RAM |
1 GB |
|
Free Disk Space |
ca. 85 MB of free hard drive space for a complete installation |
|
Internet Connection |
Persistent Internet connection with a recommended bandwidth of at least 64 kbps |
|
Firewall |
Ports 80 and 2088 (TCP) need to be open for TCP/IP traffic to the market data server (allowing HTTP traffic is not sufficient). Personal firewalls have to be set up to allow traffic for TeleTrader Professional. |
For further information, please consult the documentation accessible over the Help menu or visit us at http://professional.teletrader.com .
If you have any questions, contact our support team:
▫ On the Help menu, click Online Support and enter your request as detailed as possible.
▫ Send us an e-mail at support@teletrader.com – please mention your Professional user name in the message!
© TeleTrader Software GmbH, Marc-Aurel-Straße 10-12, A-1010 Vienna, Austria