 Using
Studies and Expressions in Chartable Expressions
Using
Studies and Expressions in Chartable Expressions
Vertical
Price Page now available as document instead of template
Remove
all study-related columns from a Price Page at once
New
chart printing settings: Gray Shades, Monochrome and Partial Color
Open
Futures continuation symbol as specific document from Symbol Search
Call
up Buy / Sell order dialog directly from Symbol Search in ViTrade
The new, improved version of chartable expressions allows you to use existing studies and expressions when creating a new expression.

Note Studies and expressions that you want to use for the new expression can be hidden, but have to exist on the chart.
This chartable expression shows the difference between the Dow Jones Industrial Average index close price and the Moving Average Simple study.
▫ Make sure that Dow Jones Industrial Average (DJIA) and Moving Average Simple study are inserted into the chart.
▫ In the chart pane where you want to insert the expression, type an equal sign = to start the chartable expression.
▫ In the list that appears, double-click the symbol name, Dow Jones Industrial Average (DJIA).
▫ In the field list, double-click the CLOSE field.
▫ Continue creating your expression by selecting the minus operator – and then double-click the MOVS(21,0) field.
▫ After you have finished writing the expression, press the Enter key. The expression is now added to your chart.
Once you created the expression, you can use it as an input value in other chartable expressions.
For more details, see the section "Syntax of Chartable Expressions" in the TeleTrader Professional User Guide under Help > Help.
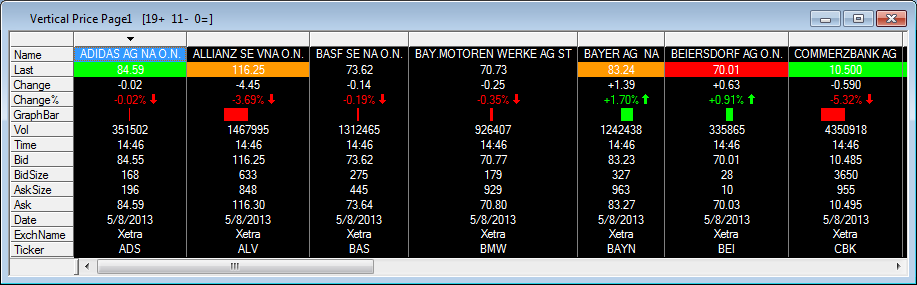
Prior to this version, Vertical Price Pages could only be opened as a Price Page template. From now on, you can open a Vertical Price Page just like any other document, apply different templates to it, save it as a separate document, as part of a virtual page or a workspace.
For more detailed information about Vertical Price Pages, see the TeleTrader Professional User Guide under Help > Help.
Now it is possible to remove all study columns added to your price page at once, instead of deleting each of them individually. This is very useful for deleting studies that are represented in price pages in form of two or more columns (e.g. MACD).
To remove all study-related columns, right-click on a study cell and choose Delete from the context menu. In the dialog that appears, select the Study radio button (e.g. Study: MACD) and click the OK button. All columns related to that study will be removed automatically.
The improved chart printing lets you print / copy / e-mail charts in three additional color setups: Gray Shades, Monochrome and Partial Color. To select your default printing color layout, open the chart that you want to print out and click on File > Chart Print Setup from the menu bar.
|
Color Setup |
Description |
|
Gray Shades |
Print the chart data in black and white, with price and time scales in gray color. |
|
Monochrome |
Print the whole chart in black and white. |
|
Partial Color |
Print the chart data in color, with white background. |
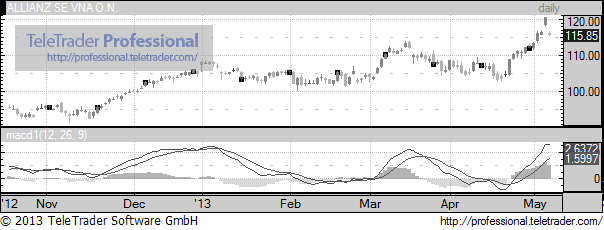

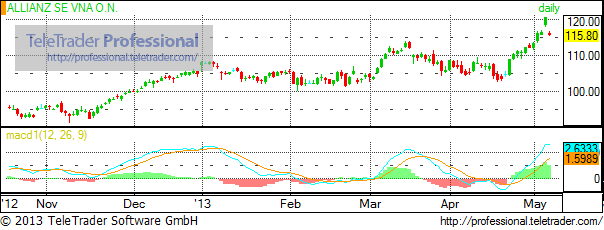
Gray Shades Monochrome Partial Color
In addition, you can apply printing color settings automatically when copying a chart to the clipboard or sending the chart by e-mail: Select the options Use same color settings for "Copy Chart" or Use same color settings for "E-mail Chart" in the Chart Print Setup dialog.
Starting with this version, it is possible to open continuation futures symbols as a price page (or any other document) directly from the Symbol Search dialog.
If you select a specific futures contract in the Symbol Search dialog, a new tab called Continuation will appear next to the Symbol Search tab. Click on it to open the continuation symbol settings page, from where you can choose which type of document will be opened by clicking on one of three buttons in the bottom right area of the dialog: Market Depth, Price Page and Chart. Additional document types are available in the Open dropdown menu.


To open futures continuation symbols as a price page from Symbol Search
▪ Click on the search field in the Symbol Search toolbar.
▪ Enter the symbol name (e.g. FDAX) and press the Enter key.
▪ Select the desired futures contract (e.g. FDAX 2013M) from the list of found symbols and then click on the Continuation tab in the top left corner of the dialog (see first picture).
▪ On the Continuation tab, click on the Price Page button in the bottom right corner of the dialog (see second picture).
In the ViTrade trading integration, it is now possible to call up a Buy / Sell order dialog directly from the Symbol Search results. Just search for the desired symbol – the Symbol Search dialog will appear with all found symbols. Right-click the desired symbol and choose Buy or Sell from the context menu, depending on which dialog you wish to open.

Note You can also open the order dialog by selecting the symbol and using the shortcut Alt + F1 for the Order (BUY) dialog or Alt + F2 for the Order (SELL) dialog.
The following studies have been added:
▫ Halloween indicator, as featured in Stocks & Commodities, October 2012: This study exploits a simple and effective strategy: The stocks are purchased on October 1 if price of the security surpasses its 50-day moving average, then retained until May 1 of the next calendar year .
▫ VIX Trading System, as featured in Stocks & Commodities, December 2012: This study generates Buy / Sell signals if VIX index is below / above of the 50-day moving average (based on VIX Low price) for 11 days in a row. On the 11th day, the Buy / Sell signal is generated.
For detailed information about the new studies refer to the Analysis Tools manual, which is accessible from the Help menu.
The following bug has been fixed:
▫ When opening two or more Time&Sales documents for the same symbol in a row, the second document sometimes had duplicated ticks.
|
Hardware |
PC with 1,66 GHz or higher |
|
Operating System |
Windows 8, Windows 7 (recommended) |
|
RAM |
1 GB |
|
Free Disk Space |
ca. 80 MB of free hard drive space for a complete installation |
|
Internet Connection |
Persistent Internet connection with a recommended bandwidth of at least 64 kbps |
|
Firewall |
Either port 80 or 2088 (TCP) need to be open for TCP/IP traffic to the market data server (allowing HTTP traffic is not sufficient). Personal firewalls have to be set up to allow traffic for TeleTrader Professional. |
For further information, please consult the documentation accessible over the Help menu or visit us at http://professional.teletrader.com .
If you have any questions, contact our support team:
▫ On the Help menu, click Online Support and enter your request as detailed as possible.
▫ Send us an e-mail at support@teletrader.com – please mention your Professional user name in the message!
© TeleTrader Software GmbH, Marc-Aurel-Straße 10-12, A-1010 Vienna, Austria