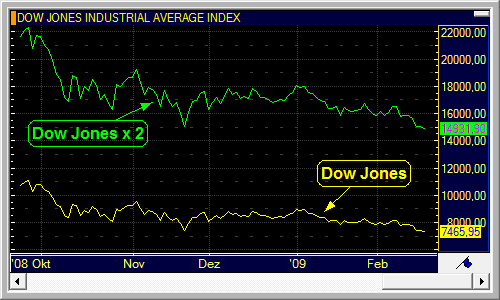
With the Text tool, you can label other objects on the chart, add descriptions etc.

You can also show a rectangle around the text, and add one or more arrows that point from the text to other chart objects. In addition, you can change the font and color of the text: See Customizing Text.
▪ Click on the Text icon on the Drawing toolbar: 
▪ Click on the chart at the position where you want the text to appear.
▪ Type your text. Press the Enter key when you are finished.
Note To insert a line break in the text, use Ctrl + Enter.
▪ Click on the Select icon on the Drawing toolbar: 
▪ Double-click the text object.
▪ Edit the text. Press the Enter key when you are finished.