Regression lines and channels are based on the best fit of all prices between a starting point and an end point. The best fit is determined by calculating the least amount of space between the price points and the linear regression line, using the method of least squares. The regression line thus represents the median line of the changing price. It can be considered as an equilibrium price line – any deflection up or down indicates super-activity of buyers or sellers.
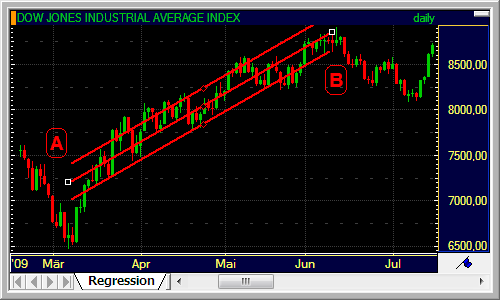
To draw a regression line, you need two reference points (A and B). The reference points define the period of time for which the linear regression trend is shown on the chart.
The regression channel lines are automatically added at a distance of one standard deviation above and below the regression line. The channel borders serve as support / resistance lines. You can add more channel lines at a distance of two, three or more standard deviations from the regression line above and below the channel.
You can change the color and style of the regression line or channel: See Customizing Regression Lines and Regression Channels.
▪ Click on the Regression Line icon on the Drawing toolbar: 
▪ Click on the chart at the first reference point of your line (A) and hold the mouse button down.
▪ Move the mouse pointer to the second reference point of your line (B) and release the mouse button.
▪ Click on the arrow next to
the Regression Line icon on the Drawing toolbar, and then click on the Regression Channel icon: 
▪ Click on the chart at the first reference point of your line (A) and hold the mouse button down.
▪ Move the mouse pointer to the second reference point of your line (B) and release the mouse button.
▪ Click on the regression channel to select it.
▪ Click on any visibility point of the channel and hold the mouse button down.
▪ Drag the visibility point upwards or downwards until white preview lines appear above and below the channel.
▪ You can drag the visibility point further to create more channel lines at a distance of two, three or more standard deviations from the regression line.
▪ Release the mouse button to add the additional lines to the chart.
Note To remove (hide) additional lines again, see Hiding and Showing Lines / Levels with Visibility Points.