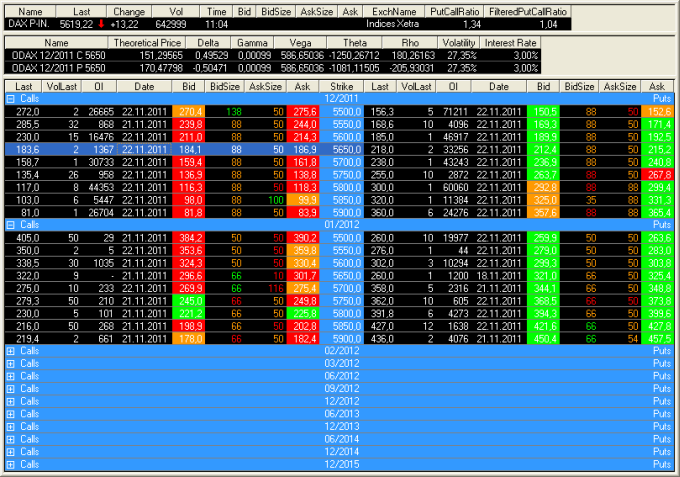
The options matrix shows all options for an underlying symbol
(for example a stock, index or future). The options are grouped by expiration
date or by strike price, with Calls on the left side and Puts on the right side.
Note
Currently the options matrix is only available for options traded on Eurex.
When you try to open an options matrix for an underlying symbol for which
more than one options product is traded on Eurex (e.g. the BASF stock), you can
choose the appropriate options in a dialog (e.g. BASF Options or BASF European Options). To
remember your choice, select the option Always use
this product in the dialog. If you want to see the dialog again later,
press and hold the Shift key while trying to
open an options matrix for this underlying.
You can also easily open a price
page with options symbols / underlyings by using the command Related Symbols. See Opening Related Symbols in a Price
Page.
Underlying view and options matrix view
Information about the underlying symbol is shown on top. Below, the options for this symbol are displayed: Calls on the left and Puts on the right. The column layout in the options matrix view can be mirrored or identical on both sides. You can also change the number of decimal places that is shown for both the underlying and its options.
Learn more:
 Showing, Hiding and Changing
Views
Showing, Hiding and Changing
Views
Changing the Number of Decimal
Places
Customizing the Underlying View
Customizing the Options Matrix
View
Options organized into groups
The options are grouped by their expiration date or by their strike price. Grouping by expiration date is the default setting – in that case, the middle column (shown in the same color as the group headers) displays the available strike prices for the chosen expiration date. The group containing the front month options is expanded automatically – other groups can be expanded or collapsed by double-clicking their group header.
Learn more:
Showing, Hiding and Changing
Views
Greeks, Put/Call Ratio and filtered Put/Call Ratio
You can show both the so-called "Greeks" and the Put/Call Ratio in the options matrix document. The Greeks (Theoretical Value, Delta, Gamma, Vega, Theta, Rho) for the highlighted options contracts are shown in a separate Greeks view. The current Put/Call Ratio of all options for an underlying is shown as an additional column in the underlying view of the options matrix. You can also add a column showing the filtered Put/Call Ratio there – this ratio is calculated only from the data that is currently visible in the options matrix (taking into account all expanded groups and filter settings).
Learn more:
Showing Greeks and the Put/Call
Ratio
Filter by expiration date or strike price
You can choose which expiration dates and strike prices should be visible in the options matrix view.
Learn more:
Filtering Information in the
Options Matrix
Get notifications when prices change
To get an automatic notification (sound, message or e-mail) when the price of an option reaches a certain level, use price alerts.
Learn more: