TeleTrader WorkStation can be used to display quote data for a wide range of securities, as well as current news from all over the world, fundamental data such as company profiles or financial figures, and analyst recommendations.
Quote data can be visualized in different ways, depending on your needs. For example, if you want to display the last price of several symbols at once, you will probably choose a tabular layout, as in a price page or watch list. If you want to show the development of historical and current data for one symbol at once, you will choose a chart where you can see the whole time series of a symbol.
News stories, company profiles and analyst recommendations can be requested specifically for a symbol. News headlines can also be displayed in a constantly updating overview.
In TeleTrader WorkStation, you can display symbols, their quote data and other data in documents, or in a pop-up window or pane.
TeleTrader WorkStation documents
Documents are windows displayed inside the TeleTrader WorkStation main window. Each document shows a different view of the data and offers different functions. You can create as many documents as you like and save them inside a workspace.
The following document types are available:
|
|
Price Page |
Overview of symbols in a table |
|
|
Vertical Price Page |
Overview of symbols in a table in transposed view compared to "classic" price pages |
|
|
Chart |
Visualization of the time series of a symbol |
|
|
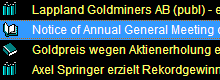
News |
Current news from all over the world |
|
|
Market Depth |
Summary of all orders that are currently in the market |
|
|
Time and Sales |
Chronological list of all orders and trades |
|
|
Watch List |
Overview of symbols with basic portfolio functionality |
|
|
Options Matrix |
Matrix of Call and Put options for an underlying, grouped by strike price or expiration date |
|
|
Quick Quote |
Current price activity of one symbol |
|
|
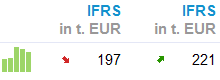
Profile |
Fundamental values, company information and balance sheet data |
|
|
Analyzer |
Graphical representation of analyst recommendations
Note: The Analyzer is not included in all data packages. |
|
|
Web Watch |
Any web page in an embedded browser window |


Ticker pane
The Ticker pane also shows quote data on the screen. Unlike documents, you can only display it on the screen once.
|
|
Ticker |
Live ticker with several symbols |

What is a symbol?
In TeleTrader WorkStation, all stocks, futures, options, indices and other securities are called symbols. A symbol is the unique identification given to every security that is traded on an exchange or over-the-counter market.
Each symbol has a type, which designates the category of the security or financial instrument. These categories are: Stock, Future, Index, Currency, Warrant, Bond, Mutual Fund, Interest Rate, Option, Put Option, Call Option, Certificate.
There is an additional special symbol type: The so-called chain symbol. This symbol does not hold data from one security, but is rather a pointer to a list of "normal" symbols of different types, like a list of index constituents. The list of symbols contained in a chain is automatically updated on the server. This means that when for example some new stocks are added to the list of index constituents, the chain list will be automatically updated. Currently, chain symbols can only be opened in price pages and time and sales documents – in other document types, you can only open the list of symbols that the chain refers to (but the list will not be updated when it changes on the server).
 Price Page