You have now divided your screen into two virtual pages. On each page, you display at least one chart document:


We will now work with these charts and for example add a trend line and a study, set an alert and link a chart to the price page.
▪ You should now see the virtual page Indices on the screen (if you don’t, press F12 to switch to it). This page contains two charts. We now want to change the compression of one of these charts from Daily to Weekly.
▪ Click on the chart that you want to change (it doesn’t matter which of them you choose). Then have a look at the Chart toolbar: You can see that one icon is selected. This is the icon for daily compression – this means that each bar (or candle) that you see on the chart represents the data for one day.

▪ Now click on the icon to the right of the selected icon – the compression is changed to Weekly. This means that each bar on the chart represents a week’s data.
Note You can also display charts with a monthly compression and even intraday or tick compressions.
▪ To work with the chart, and better interpret the data you are seeing there, you can use a range of drawing tools in TeleTrader WorkStation. These are graphical studies that are applied to the chart, or rather, to the time series displayed in the chart.
Note A time series is the visualization of a symbol with its current and historic data – it means that for each point in time you have a set of values (the Open, High, Low and Close prices of the security) that are normally displayed as bars or candles. As you have already learned, you can change the compression of these bars, so that each bar represents a day, a week, a month or some other period of time (e.g. 5 minutes).
▪ We will now draw a trend line on one of our charts. The trend line is one of the most basic drawing tools. As you probably know, it needs two reference points, which are usually placed at two pivots (highs or lows) of the time series.
▪ You can find all drawing tools on the Drawing toolbar. To activate the Free Line tool, click on its icon.

▪ Now you will draw the trend line on the chart. It has two reference points – to set the first reference point (starting point), click on this point in the chart and hold the mouse button down.
▪ Move the mouse pointer to the second reference point (end point) and release the mouse button when you have reached the second point.

▪ The trend line is now inserted into the chart. You can move it around by dragging it with the mouse, you can extend or shorten it with its so-called extension points (see Extending and Shortening Lines with Extension Points) and duplicate it with its visibility point (see Lines and Trend Channels).
▪ There is also a second way to interpret the data on your charts, and even generate buy and sell signals: You can add a study to your chart. These are mathematical techniques that use calculations and statistics to help you identify and analyze market opportunities and risks. An indicator visualizes the data in a different way to help you interpret it more easily, whereas a signal also gives you hints to establish long or short positions or identifies typical constellations that have been significant in the past.
Note Please always bear in mind that no matter which indicator or signal you use, in the end you always have to take the responsibility for your trading decisions yourself.
▪ We will add an indicator to one of our charts: The Simple Moving Average, which calculates the sum of a number of values over a period of time and divides them by their number. The result is drawn on the chart as a line that is used to identify or confirm a trend.
▪ To insert an indicator (or a signal), you use the Insert Study dialog: Right-click on the chart and choose Insert Study.
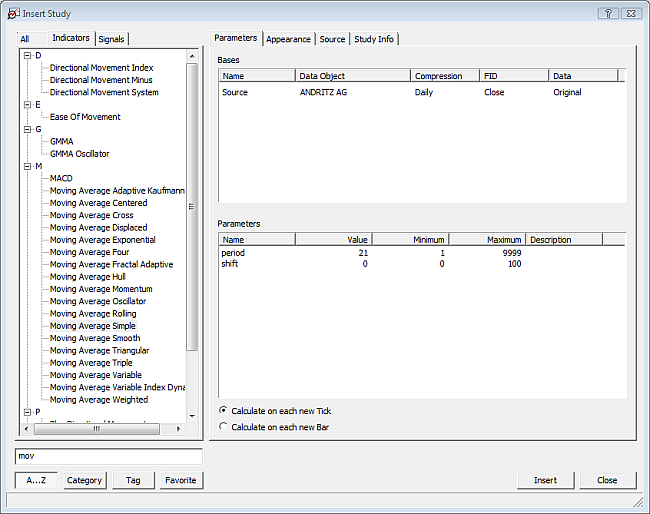
▪ The dialog shows all available studies on the left side, and their parameters and other attributes on the right side. Look for Moving Average Simple in the list on the left side. You will find it under the letter M, or in the category Trend. Click on it to choose it as the study that you want to insert.
▪ You can now adapt the parameters of this study. As you know, the Moving Average is always based on a certain period of time. When the period is longer, it lags behind the actual price movements more, but its interpretation is also more significant. Change the parameter period to a value of your choice: Click in the Value column and enter the new value there.
Note You can also change the appearance of the study on the Appearance tab, or look at how it is calculated on the Source tab. See Defining the Appearance of a Study.
▪ Now you can click Insert to insert the Moving Average into your chart. It is drawn as a line in the same chart pane as your symbol. (Other indicators or signals can be inserted in a separate pane by default.)

▪ Click Close to return to your chart.
Note If you want to add Volume and Open Interest to your chart: These are also defined as studies and can be inserted in the same way as any other study from the Insert Study dialog.
▪ Like in a price page (and essentially, in all documents), you can do many customizations in a chart. You can for example change the color of the Moving Average that you just have inserted. To do this, click on the study line so that it is selected.

▪ For changing the color and style of a line in a chart, which is a task done rather often, two icons are available on the Drawing toolbar. To change the color of the line, click on the Color icon and choose a new color from the color selector.

▪ If you want to change the line style, click on the Next Line Style icon. With each click, another line style is applied. Just click until you reach the style you like.

Note Of course you can also change all of these (and many more) properties in the Chart Properties dialog. There are a lot of options available, so customizing a chart is explained in more depth elsewhere: See Customizing the Charts.
▪ When you are monitoring an indicator like the Moving Average, you are often interested in its intersections with the time series. That means, you want to know for example when the price rises above the Moving Average line or falls below the Moving Average line. You could of course look at the chart every few minutes to see if something has changed, but there is a much easier way: Just let TeleTrader WorkStation notify you when something interesting happens. For this, you use alerts.
▪ There are five types of alerts: Time alerts (these work sort of like an alarm clock), Price alerts (notify you when the price reaches a certain level), News alerts (when news messages arrive that contain a certain keyword), Study alerts (when a signal marker appears on the chart) and Intersection alerts. We will use an intersection alert to tell when the price of our symbol crosses the Moving Average line.
▪ Right-click in the chart where you inserted the Moving Average indicator and choose Insert > Intersection Alert. A dialog is shown – you now have to choose under which conditions you want to be notified. First, you have to choose what two objects are interesting to you. In our example, the first object is the symbol of the chart (for example the NASDAQ 100), and the second interesting object is the Moving Average line, which is called movs in the dialog.
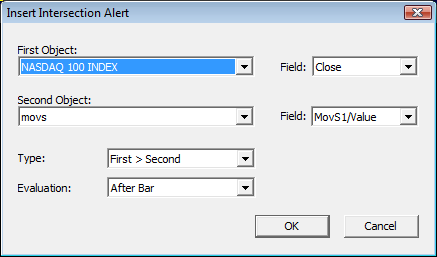
Note If you see another object that is called Line1, this might be your trend line. You can see that intersection alerts can also be used with drawing tools!
▪ Next to the Object fields, you can see two lists called Field. Here, you define what value of each object is interesting to you. For the Moving Average, you only have one value to choose from. But your symbol offers more possibilities: You could monitor the Open, High, Low or Close price, or even the Volume or Open Interest of the security. Normally, you will choose the Close price here, which is also the default setting.
▪ You have even more settings to define in which case you want to be notified: In the Type list you can choose if you want to be notified on any intersection, or just when the price crosses the Moving Average line from above (First < Second) or from below (First > Second). In the Evaluation list, you can choose if TeleTrader WorkStation should check the conditions for the alert after each tick, or only after the bar is complete.
▪ When you have set all conditions for your alert, click OK. You will now see the Alerts window that shows an overview of all alerts that are active at the moment. Double-click in the Actions column: The Alert Action Editor appears. Here, you can choose which kind of notification you want to receive when the alert is triggered (that is, when the symbol’s time series and the Moving Average line actually intersect): It can be a Notification that is shown on the screen as a pop-up, a Sound or even an E-Mail that is sent to you.

Note If you want to use the E-Mail notification, you have to configure TeleTrader WorkStation for using your e-mail account first. See E-Mail Settings.