In a chart, TeleTrader WorkStation plots many data points on the screen as bars, candlesticks or in some other form of visualization (see Changing the Chart Type for an overview of the available visualizations). For real-time quotes, data is transmitted internally from the exchanges as tick by tick data – this means, whenever a trade occurs, a new data point is added. You can of course show the flow of tick by tick data in a chart, but more often you will want to get an overview over a longer period of time – in this case, the data will be compressed for you.
Compression means that TeleTrader WorkStation looks at a group of ticks, for example all ticks of a day, but uses only up to four of these values to draw the next data point (bar, candlestick etc.): The first and last prices of the day (Open and Close), and the highest and lowest price of the day (High and Low). Some chart types, such as line charts, only use the Close price – in that case, all the data of a whole day is compressed into a single value.
There are two different types of compression:
▫ Time compression: This form of data compression is used in most charts. Every data point, bar, candlestick etc. represents a fixed period of time, for example a day, a week or 10 minutes. For every period, the Open, High, Low and Close prices are determined. With this information, the next data point (bar, candlestick, Point and Figure box etc.) for this period is drawn on the chart as soon as the period is over. For example, if you use a one-hour candlestick chart, at the end of each hour a new candle is added. Time compressions include Intraday, Daily, Weekly and Monthly compressions. The most common compression is the Daily compression, which is also used as a default in TeleTrader WorkStation.
▫ Tick compression: This means that several ticks (trades) are grouped together and compressed to form a data point (for example, a bar or candlestick). If you use for example a tick compression of 10 ticks, then all ticks are grouped in sets of ten. The Open price of a 10-tick bar is the first tick, the Close price is the tenth tick. The High and Low prices are the highest and lowest prices in the set of ten ticks, respectively. Tick compressions do not have a linear time scale – depending on the frequency of incoming ticks, a 10-tick bar can comprise a period of seconds, minutes or even days (for infrequently traded securities). Tickbar is the only tick compression available; the "compression" Tick by Tick in fact shows uncompressed data.
The current data compression is shown in the upper right corner of the chart header.
▪ Click on the corresponding icon in the Chart toolbar:
|
|
Tick by Tick |
Every tick (last price) of the symbol is plotted as a separate data point. Use this setting if you want to see uncompressed data (for example, real time quotes as they come in). |
|
|
Tickbar |
A number of ticks are compressed to form a bar (or other plotted data point). You can set the number of ticks that are used for each bar. In the chart header, you can see the number of remaining ticks until the next bar is drawn. |
|
|
Intraday |
All ticks that occur in an interval of a number of minutes or hours are compressed to form a bar (or other plotted data point). You can choose the time interval that is used for each bar. In the chart header, you can see the remaining time until the next bar is drawn. |
|
|
Daily |
All ticks of a day are compressed to form a bar (or other plotted data point). |
|
|
Weekly |
All ticks of a week are compressed to form a bar (or other plotted data point). For securities that are also traded on weekends (Forex, Futures) the weekly bar starts with Sunday's Open price. |
|
|
Monthly |
All ticks of a month are compressed to form a bar (or other plotted data point). |


▪ Depending on your choice, you will have to add some details about the data compression that you wish to apply to the chart:
- If you choose a tick by tick, daily, monthly or weekly compression, the data compression of the chart will change immediately.
-
If you choose a tickbar compression, you
will be asked to enter the number of ticks that are used for each
bar: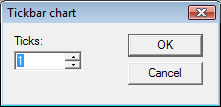
-
If you choose an intraday compression, you
will be asked to choose the time interval that is used for each bar. You can
also enter an Offset value, which means that
the time series will be offset by the number of hours or minutes that you enter.
(For example, if the first 60-minute bar would be at 9:00 to 10:00, and you
offset it by 5 minutes, the first bar would then be at 8:05 to 9:05, the second
bar at 9:05 to 10:05 and so on.)
Note
You can also choose the most common tickbar or intraday compressions by clicking
on the arrow next to the Tickbar  or Intraday
  icon.
icon.
Alternatively, you can also change the data compression of a chart with a menu command or in the properties dialog:
▫ On the Chart menu, click Compression and choose the data compression that you want to use.
▫ In the Chart Properties dialog, choose General > Type. See also Customizing the Chart.