When you write a custom indicator or signal with the TeleTrader Language, you will most likely want to plot the results of your program on a chart in TeleTrader WorkStation. As you know, each chart displays at least one time series – this can for example be a security. We will assume that the time series is indeed a security, such as a stock, although it could also be something else, like another study.
The term "time series" means that for each point in time, for example for each day on a daily chart, you have a set of values (for a stock, these are usually the Open, High, Low and Close prices) that are normally displayed as bars or candles. When you write a program that plots for example the Moving Average, you want to draw a line on the chart that changes direction with every new bar. That means that there has to be a value for your line for each bar that is shown on the screen.
Fortunately, you do not have to worry about this at all. You only have to tell TeleTrader WorkStation how it can calculate a value for one single bar. For example, in this example of the execution section for the Moving Average you can see that there is only one line used to calculate a single value for the variable Result:
Begin
Result = Sum(source, period) / period;
DrawLine("movs", Result);
End.
When the program is run, TeleTrader WorkStation automatically repeats the calculations in the execution section for each bar on the chart. In the end, it has a whole series of values that it then can plot as a line on the screen that spans the whole chart.
So, when you write a program, you only have to concentrate on calculating your result for one single bar, and TeleTrader WorkStation does the rest for you when you execute your program.
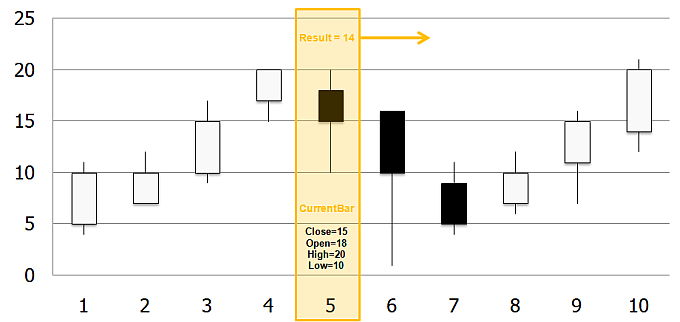
When you use a study, TeleTrader WorkStation looks at the source code and runs the execution section once for each bar, starting from the first bar on the left. It only concentrates on one bar at a time and uses the values available for this bar (the current bar) for its calculations, if you don’t specify otherwise.
You can also use values of past and future bars in your calculations – how you can do this is explained in the next section, Accessing the Time Series.