TeleTrader WorkStation offers a large amount of analysis tools (studies) to calculate indicators and signals. All available TeleTrader studies that can be shown on a chart, including custom studies that you wrote yourself, can also be shown in a price page.
Depending on the study, one or more columns are added to the price page. For each row / symbol that is visible on the price page, the current study value is calculated. Per default, the studies are calculated for daily data, but you can also configure them to be calculated for other data compressions (Weekly, Monthly, Intraday, TickBar or Tick by Tick data).
For each inserted study, you can hide certain study columns, suspend calculation for some rows to improve performance, rename study , change the parameters for a study (including the time region / history that is downloaded for each symbol), and define custom colors for study columns.
Note You can include all studies already visible in a price page, when opening a new chart with the option Insert existing studies when opening chart from price page. To change this setting, choose Tools > Options > Price Page from the menu bar.
For more information about studies in general, see Analysis Tools.
▪ Right-click in the price page and select Insert Study.
▪ All available studies are shown on the left side of the Insert Study dialog. Click on the study that you want to insert. See also Inserting Studies for more details about the Insert Study dialog.
▪ On the Parameters tab on the right side, adapt the bases and parameters of your study to your needs, and choose the compression that should be used for you study (for example, Daily, 10 Minutes,..). For details about the possible settings, see below.
▪ On the Appearance tab, adapt the colors that should be used for the study columns (if necessary). For details about the possible settings, see below.
▪ Click Insert to insert the study into the price page. Depending on the study, one or several study columns will be added to your price page:
|
Lines |
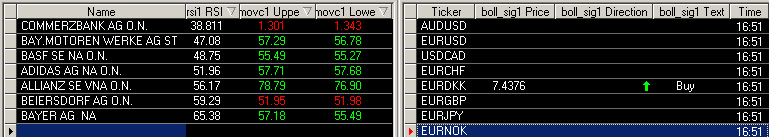
For lines, such as the Moving Average Simple, one column will be added to the price page. It displays the most recent value for each symbol (depending on the chosen compression). |
|
|
Areas |
For areas, such as Bollinger Bands, two columns will be added to the price page. They display the current Upper and Lower value of the study area for each symbol. |
|
|
Markers |
For markers, such as the Hammer candlestick pattern, three columns will be added to the price page. They display the Text, Direction and Price for the marker. A marker will only be shown for those rows / symbols where the marker condition has been met on the current bar (depending on the chosen compression). |
|


Some studies that consist of several areas, markers or lines add many columns to the price page when inserted. You can hide some of these columns and only keep those visible that you need.
▪ Right-click in the price page and choose Properties.
▪ In the Price Page Properties dialog, click Columns.
▪ Select the column that you want to remove from the Displayed Columns list.
▪ Click the << button.
To add hidden study columns to a price page again
▪ Right-click in the price page and choose Properties.
▪ In the Price Page Properties dialog, click Columns.
▪ From the Displayed Columns list, choose the column after which the new column should appear.
▪ Choose the column that you want to add from the Available Columns list.
▪ Click the >> button.
▪ Remove all visible study columns from the price page (see above). When all columns of a study are hidden / removed, the complete study will be removed from the price page.
Note You can also remove all visible study columns by right-clicking on a study cell and choosing Delete from the context menu. In the dialog that appears, select the Study radio button (e.g. Study: MACD) and click the OK button.
Since calculating study values for many symbols at once can lead to performance problems, you can suspend study calculations for specific symbols (rows).
▪ Right-click the symbol / row and choose Suspend Study Calculations.
Note Once study calculations are suspended, last updated values will stay visible until calculations are continued. To continue study calculations at a later point, right-click the symbol / row again and choose Continue Study Calculations.
▪ Right-click study column header in the price page and choose Rename Study....
▪ In the Set Study Name dialog, modify current column name or enter a new one.
▪ Click the Ok button.
On the Parameters tab of the Insert Study dialog, you can set the bases and input parameters for a study before you insert it. After you have inserted a study, you can still change these parameters in the Price Page Properties dialog under Studies > [Study Name] > Parameters.
Setting study parameters in price pages generally works the same way as setting study parameters in charts (see Setting the Parameters of a Study for details), with the following differences:
▫ In the Data Object column under Bases, you will find an entry Row Symbol per default. Use this entry to calculate the study for each symbol of the price page. If you choose a fixed base symbol instead (using the entry Other and Symbol Search), the same symbol will be used as the calculation base for every row. This can be useful for studies that need two bases (for example Spread Relative).
▫ In the Compression column under Bases, you can change the data compression of the time series that is used to calculate the study values. The compression is set to Daily per default, but you can also use Monthly, Weekly, Intraday, TickBar and Tick by Tick compressions instead.
▫ On the bottom right of
the Parameters tab, you can change the time
region that is used for calculating the study. This setting influences the
amount of historical time series data that is downloaded for each symbol of the
price page. Per default, an appropriate setting is chosen automatically for each
study (often depending on the currently set study parameters such as the
period of a
Moving Average). If you do not get the appropriate results for your study, you
can change this setting by selecting Use custom time
region and entering the appropriate amount of bars.
Note
If you add too little history, the study might not be calculated (leading to an
empty value in the study column),
If you add too much history, this can
affect performance, since the history must be downloaded for every symbol in the
price page.
▫ It is at the moment not possible to base studies on other studies in price pages (although that is of course possible in charts, see Basing Studies on Other Studies).
On the Appearance tab of the Insert Study dialog, you can choose custom colors that should be used for the study columns on a price page before you insert the study. After you have inserted a study, you can still change these colors in the Price Page Properties dialog under Studies > [Study Name] > Appearance.
Per default, if not defined otherwise under Appearance, the column is shown in the same color as all other price page columns.
In contrast to defining the appearance of studies in charts (see Defining the Appearance of a Study), you can only choose from the following settings for price page study objects:
|
Lines |
Check the box next to the Color selection to use a custom color for the study column. |
|
Areas |
Fixed
coloring Check the
boxes next to the Line #1 and Line #2 selections to use a custom color for
the Upper and Lower study columns. Relative
coloring Check the boxes next to the #1 above #2 and #2
above #1 selections to use different colors depending on which of
the two area lines is higher (useful for studies such as Moving Average
Cross). |
|
Markers |
Check the box next to the Up Border and Down Border color selections to use a custom color for the Text, Direction and Price study columns. |